10 Customer Retention Metrics & How to Measure Them

- Customer retention is critical for sustainable growth—losing customers due to poor experiences (not price) is a common issue. Tracking why they leave helps prevent churn and builds loyalty.
- There are 10 essential customer retention metrics you should monitor, including Customer Retention Rate (CRR), Repeat Purchase Rate (RPR), Customer Lifetime Value (CLV), Net Promoter Score (NPS), and Churn Rate. These metrics offer a mix of quantitative insights and customer sentiment.
- Improving retention requires action based on data—by analyzing these KPIs, businesses can personalize engagement, fix service gaps, and drive long-term loyalty and revenue.
- Tools like ClearlyRated make it easier to collect feedback, benchmark performance, and uncover actionable insights using AI-powered analysis, helping you act proactively.
- Retention is not just about satisfaction—it’s about experience. Personalization, loyalty programs, proactive support, and data-driven decisions are key levers to reduce churn and increase lifetime value.
A study found that 73% of people ditch brands because of poor customer service, not due to price or product quality. Are customers who leave usually unhappy with your support? Do they stop buying after a particular event or interaction? How does your communication, delivery, or product experience impact their decision?
Answering these questions gives you deeper insight into areas for improvement. This proactive approach helps you catch issues early, fix them, and boost loyalty. In the SaaS industry, for example, it often costs four to five times more to win a new customer than to keep a current one.
In this article, we’ll explore 10 customer retention metrics, how to measure client retention, and why measuring customer retention KPIs is crucial for improving customer loyalty and driving long-term growth.
What Are Customer Retention Metrics?
Customer retention metrics are key indicators that help businesses track and understand how well they retain their customers. These metrics focus on the underlying reasons behind customer behavior, address pain points, and improve the overall customer experience, leading to higher customer loyalty and reduced churn.
Customer retention metrics can be both quantitative and qualitative. While quantitative metrics offer hard numbers that are easier to measure and track, qualitative metrics provide deeper insights into customer feelings, opinions, and perceptions.
Here's how they differ:

10 Customer Retention Metrics and KPIs to Track for Business Growth
You can make informed decisions by monitoring the right KPIs, adjusting your strategies, and keeping customers returning.
Here are the top customer retention metrics every business should monitor:
1. Customer Retention Rate (CRR)
The customer retention rate (CRR) is a metric that shows the percentage of customers who remain loyal to your business over a specific period. This is especially important for companies with recurring revenue models, like SaaS or ecommerce stores. A low CRR suggests issues in your customer experience, from the purchasing process to service quality.
Here’s how to measure customer retention rate:
Customer retention rate = [(E-N)/S] x 100
- E is the number of customers at the end of the period
- N is the number of new customers gained during the period
- S is the number of customers at the start of the period
Imagine you started the quarter with 2,500 customers, gained 600 new ones, and ended the quarter with 2,800 customers. Here’s how you calculate your CRR:
((2800 - 600) / 2500) x 100 = 88%
An 88% CRR means you’ve retained most of your customers, which is a solid result. However, any retention rate under 90% could still signal room for improvement. Analyzing customer feedback can help highlight why 12% of customers left and how you can improve.
For SaaS businesses, an average retention rate of 92-97% is considered good. If your CRR falls below this, it’s essential to study why customers are leaving. Tools like surveys, session replays, or customer feedback can help identify pain points.
2. Repeat Purchase Rate (RPR)
The repeat purchase rate (RPR) shows how often customers return to buy from you again. It’s a powerful metric because repeat buyers typically generate more revenue at a lower cost than new customers.
If your RPR is high, that’s a sign you’re creating experiences that encourage customers to return. If it's low, you may need to rethink your approach to customer satisfaction, product offerings, or loyalty programs.
To calculate RPR, you can use this formula:
Repeat Purchase Rate = [Number of customers who made more than one purchase/ Total number of customers ] x 100
For example, if 200 out of 1,000 customers made repeat purchases, your RPR would be:
(200/1000) x 100 = 20%
A 20% RPR shows that one in five customers is coming back. A good benchmark depends on your industry. In e-commerce, for example, an RPR between 20% and 30% is usually a positive sign—it shows your customers are satisfied and likely to come back. If it’s above 30%, that’s even better. It signals strong customer loyalty and high engagement with your brand.
If your RPR is low, it's time to conduct a customer retention analysis. To begin with, look into what’s working and what’s not. Are your customers satisfied with their first purchase? Are they receiving personalized offers to encourage a second?
Keep an eye on the behavior of repeat buyers and make it easy for them to buy again. You can increase RPR by focusing on customer satisfaction, product quality, and a smooth re-engagement strategy. In addition, offer them something of value, like exclusive deals or personalized suggestions.
It’s simple: happy, engaged customers are more likely to become repeat buyers, and repeat buyers are the backbone of long-term business growth.
3. Customer Churn Rate
Customer churn measures how many customers stop doing business with you over a given period. It’s a key indicator of your customer retention efforts. If customers are leaving, there’s likely a gap somewhere in your product or service offering, and that’s something you need to address.
To calculate churn, use this formula:
Customer Churn Rate = [Customers lost during the period/ Total customers at the start of the period] ×100
Churn happens for various reasons. Perhaps your product didn’t live up to expectations, or a customer simply found a competitor. There are also situations where churn is natural, such as when a customer’s business gets acquired or they go bankrupt.
Tracking churn regularly is essential, especially if you have a large customer base. You can track churn semi-annually or annually if you’re dealing with a smaller customer list. However, if you’re seeing a high churn rate, that signals an immediate need for action.
What is a good customer churn rate?
Many businesses accept a churn rate of 2-8% annually. But anything higher than that raises a red flag.
While aiming for zero churn is unrealistic, you must investigate why customers leave. Typically, a high churn rate suggests that your product or service is failing to meet customer expectations.
To reduce churn, focus on understanding the root causes. Tools like industry-tailored surveys and direct customer feedback can help uncover areas of dissatisfaction. It’s vital to regularly analyze your service from your customers' point of view. Tracking the customer retention rate KPI can also help highlight which aspects of your business are causing customers to leave.
A 2013 study showed merchants losing an average of $9 for every new customer they acquired. Fast-forward to today, and that number has jumped to $29—a 222% increase. Rising customer acquisition costs and higher product returns are major contributors to this trend.
4. Customer Lifetime Value (CLV)
Customer lifetime value (CLV) represents the total revenue your business can expect to generate from a customer over the entire duration of your relationship with them, not just from a single transaction. It’s a vital metric because a high CLV means you’re not only retaining customers but also your customers are bringing more value over time.
In fact, 25% of marketers rank it as one of the top five key metrics. CLV calculation involves several factors, including customer acquisition costs (CAC), sales expenses, and operational costs. It also uses statistical methods and AI/machine learning algorithms to predict future revenue based on historical data.
A common mistake businesses make is focusing too much on short-term sales while overlooking the long-term value that existing customers can generate.
There are two main methods to calculate CLV:
- Historic CLV: This model uses past customer behavior to calculate the value already generated. It helps you assess current relationships and segment customers based on their past spending. However, it doesn’t predict future revenue accurately.
- Predictive CLV: This model uses past data to forecast future customer value. It considers factors like purchase frequency and customer engagement to predict long-term revenue. Predictive CLV is useful for guiding future marketing strategies and investments in loyalty programs.
To calculate CLV, multiply the average revenue per customer by the duration of their relationship and subtract the costs involved in serving them.
CLV = (Revenue per customer per year × Duration of relationship) - Total costs of acquisition and service
For example, if customers spend $1,000 per year and stay for five years, their CLV would be $5,000. After factoring in service costs, you get the net profit from that customer over their lifetime.
To boost CLV, focus on enhancing customer relationships. Start with strong onboarding. A good onboarding process helps customers see the value of your product right away, setting the stage for long-term satisfaction. You can also engage customers with valuable content, such as product tips, updates, or exclusive offers.
5. Customer Satisfaction Score (CSAT)
Customer satisfaction score (CSAT) is a metric that measures how satisfied customers are with a product, service, or interaction with your business. It is typically measured by asking customers to rate their satisfaction on a scale, usually from 1 to 5 or 1 to 10, with one being the least satisfied and 5 or 10 being the most satisfied. CSAT provides immediate feedback on specific touchpoints and allows businesses to gauge overall customer sentiment.
To calculate CSAT, you need to gather responses from customers and compute the percentage of customers who rate their satisfaction positively. Here's the formula:
CSAT = (Number of satisfied customers / Total number of responses) x 100
- Satisfied customers are those who give a rating of 4 or 5 (on a 5-point scale) or 8-10 (on a 10-point scale).
- Total number of responses is the total number of customers who participated in the survey.
Suppose you collect responses from 200 customers. Out of these, 150 customers rate their satisfaction as 4 or 5 (on a 5-point scale), and 50 customers give a rating of 1, 2, or 3. To calculate CSAT:
CSAT = (150 / 200) x 100 = 75%
This means that 75% of customers were satisfied with their experience.
You can gather CSAT data through various methods to reach customers at the right moments in their journey. Common approaches include sending post-interaction surveys after customer service calls, emails, or live chat sessions, where customers rate their satisfaction.
After a purchase or service experience, prompt customers to complete a short survey. You can also distribute surveys via email, website pop-ups, or mobile app notifications. A simple question like, "How satisfied were you with your recent purchase?" can provide valuable feedback.
Once you gather CSAT data, the next step is to interpret and use it. First, monitor trends over time to identify any consistent patterns, such as recurring dissatisfaction with a particular product or service. It's also important to analyze the feedback on a granular level, looking at responses based on specific customer segments or interactions. This can help you identify any issues that might be affecting certain groups more than others.
6. Net Promoter Score® (NPS)
Net promoter score® (NPS) is a key metric for measuring customer loyalty. It’s based on the simple question: “How likely are you to recommend our product or service to a friend or colleague?”
Customers rate this on a scale of 0-10. Based on their responses, customers are categorized into three groups:
- Promoters (9-10): These customers are your most loyal fans. They are likely to recommend your brand and return for future purchases.
- Passives (7-8): These customers are satisfied but not enthusiastic. They are unlikely to actively promote or detract from your business.
- Detractors (0-6): These customers are unhappy and may discourage others from using your product or service.
To calculate NPS, subtract the percentage of Detractors from the percentage of Promoters.
Net Promoter Score = % promoters - % detractors
If you survey 100 customers and the results are:
- 50 customers are Promoters
- 30 customers are Passives
- 20 customers are Detractors
Then the NPS would be:
NPS = (50% Promoters - 20% Detractors) = 30
This score can range from -100 (all Detractors) to +100 (all Promoters).
A high NPS suggests that customers are satisfied and likely to recommend your product, leading to lower churn and higher customer retention. In case your score is low, you can interpret NPS drivers by asking follow-up questions and identifying customer pain points.
To make the most out of CSAT data, take immediate action. Use NPS surveys to gauge satisfaction. NPS asks how likely customers are to recommend your product on a scale of 0-10. Based on their answers, categorize them into Promoters, Passives, and Detractors. Subtract the percentage of Detractors from Promoters to get your NPS score.

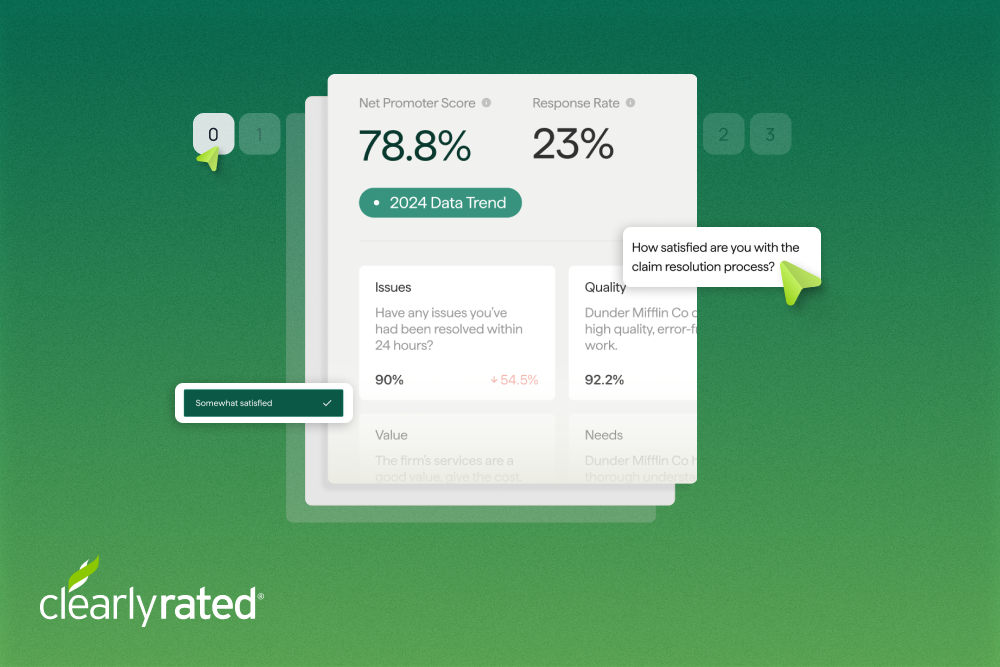
To streamline this process, you can use NPS software like ClearlyRated. This platform allows you to gather feedback efficiently, benchmark your scores against industry standards, and track trends over time.

According to ClearlyRated’s 2024 Benchmarks, the IT services industry reached its highest point in 2024, at an NPS of 55%.

Even with this progress, IT services companies still have room to improve compared to global standards. An NPS of 50% is good, while anything above 70% is considered excellent. Companies like Starbucks (77%) and USAA (75%) are leaders in customer satisfaction, while brands like Comcast struggle with a -25% NPS.
This is both a challenge and an opportunity for service providers. As customer expectations change, companies that don't keep up will struggle. But those that improve their NPS will gain a strong edge over competitors.
ClearlyRated also includes real-time customer insights and self-service tools to respond quickly to customer feedback. These features can reduce churn risks, solve issues proactively, and improve client experience, all of which can ultimately boost your CSAT.
7. Renewal Rate
Renewal rate refers to the percentage of customers who renew their subscriptions or contracts at the end of a defined period, typically annually or monthly. This metric is essential for subscription-based businesses because it directly impacts long-term revenue growth, customer retention, and overall business health.
To calculate the renewal rate, use the following formula:
Renewal Rate = (Number of renewals / Number of customers up for renewal) x 100
For example, if 200 customers are up for renewal, and 150 of them renew, the renewal rate would be:
(150 / 200) x 100 = 75%
In subscription-based models, a high renewal rate indicates strong customer satisfaction and loyalty. It shows that customers find enough value in your service to continue their subscription. Conversely, a low renewal rate suggests issues with customer experience or product satisfaction, which can hurt revenue and increase churn.
By tracking your renewal rate, you can identify potential gaps in your retention efforts. For instance, a sudden drop in renewals could suggest the need for improved customer engagement or changes to your service.
8. Net Revenue Retention (NRR)
Net revenue retention (NRR), also known as net dollar retention (NDR), is a metric that measures the revenue growth or decline from existing customers over a specific period, factoring in both expansion and churn.
Unlike traditional revenue growth metrics, NRR focuses specifically on how much revenue you’ve retained or lost from your current customer base, excluding new customer acquisitions.
To calculate NRR, use the following formula:
NRR = [(Revenue at end of period - Revenue lost from churn) + Revenue gained from upsells or expansions] / Revenue at start of period x 100
For example, if your starting revenue was $100,000, you lost $10,000 in churn, but gained $15,000 from upsells/expansion, the calculation would be:
NRR = [($100,000 - $10,000) + $15,000] / $100,000 x 100 = 105%
An NRR of over 100% indicates that your revenue growth from existing customers is outpacing the losses from churn. It’s a great sign that your existing customers are not only staying but also expanding their business with you.
On the other hand, if NRR is below 100%, it signals that churn is outpacing revenue growth from existing customers, which may point to issues with customer satisfaction or product value.
9. Customer Engagement Score
The customer engagement score (CES) measures how actively and meaningfully customers interact with your brand, products, or services over a certain period. It helps you gauge customer interest, satisfaction, and the likelihood of continued business. Unlike metrics that track churn or retention, CES focuses on the intensity and quality of customer interactions.
To calculate CES, you need to track customer actions across various touchpoints, such as website visits, emails opened, social media engagement, product usage, and customer support interactions. Here's a basic approach to calculating CES:
CES = (Total engagement actions by customers) / (Total number of customers)
For example, if 100 customers engaged with your brand 1,000 times (via actions like logins, purchases, or social interactions), the engagement score would be:
CES = 1,000 / 100 = 10
This means, on average, each customer interacted 10 times within the given period. A higher CES (71-100) indicates that customers are actively involved and engaged, while a lower score (1-40) could suggest poor user experience, lack of value, or a disconnect between customer expectations and your offerings. On the other hand, users with a CES between 41-70 engage moderately, using your product occasionally and sticking to basic features.
If you want to improve your CES, you can start by personalizing your communication. Tailoring experiences to customer needs strengthens engagement. You can also use automated follow-ups via email or SMS after purchases, offering discounts to encourage further interaction.
10. Average Order Value (AOV)
Average order value (AOV) is the average amount a customer spends per order. It’s a key metric that helps businesses understand spending patterns and evaluate the effectiveness of pricing strategies, promotions, or upselling tactics.
To calculate AOV, simply divide total revenue by the number of orders:
AOV = Total Revenue ÷ Number of Orders
For example, if your total revenue for the month is $10,000 from 500 orders, your AOV would be:
AOV = $10,000 ÷ 500 = $20
AOV acts as a benchmark for customer behavior, allowing you to set goals and evaluate the performance of your strategies.
Instead of focusing solely on driving more traffic to your website, you could find it more impactful and profitable to increase your AOV. While driving traffic often requires additional marketing spend, boosting AOV doesn't.
Since each order carries transaction costs, such as payment processing fees, shipping, and handling, increasing your AOV helps you drive more revenue and improve profits without needing more customers.
How to Improve Customer Retention Using Metrics
Improving customer retention starts with improving customer experience. By focusing on key metrics, you can gain insights that drive better customer engagement and satisfaction.
Here's how to leverage customer retention metrics for sustained business growth:
Personalization and customer experience
Today, businesses increasingly focus on using customer experience to drive tangible results. A recent study revealed that 70% of consumers believe companies need to improve their customer experience, a sentiment that has doubled since 2019. As expectations rise, more than half (54%) of customers are willing to share personal data in exchange for a better experience. This shift highlights the importance of personalization in today’s marketplace.
ClearlyRated makes this process easier by providing actionable, data-driven insights with industry-specific surveys. With this platform, you can:
- Collect feedback across various touchpoints to understand customer sentiment throughout the journey
- Segment your customers to personalize communication and improve engagement
- Set up, schedule, and customize surveys to maximize open and response rates
- Get support from ClearlyRated’s dedicated customer success team whenever you need assistance
The more personalized your approach, the greater the potential to improve your customer retention rate KPI. When you customize messaging, recommend relevant products, and send personalized follow-ups, you build stronger emotional connections with your customers. This not only enhances their experience but also drives long-term loyalty and retention.
Loyalty programs and incentives
Customer loyalty is a cornerstone for business growth. Loyal customers not only return, but they tend to spend more over time, building a greater lifetime value.
In fact, research shows that the top 10% of loyal customers spend two times more per order than the remaining 90%, and the top 1% spend 2.5 times more than the remaining 99%. This clearly indicates how important it is to cultivate long-term relationships rather than relying on one-time buyers.
One effective way to build loyalty is by rewarding customers through:
- Discounts, exclusive offers, or points systems
- Personalized rewards based on behavior or milestones (e.g., "Spend $100 and get 10% off your next order")
- Targeted incentives based on past purchases
To ensure the success of your loyalty programs, track metrics like repeat purchase rate and average order value, and monitor customer satisfaction and retention rates.
ClearlyRated consolidates customer feedback in a single view, helping you identify trends, manage issues, and take proactive action to improve loyalty. Understanding how loyalty programs impact customer retention rates can maximize customer engagement.
Proactive customer support
Another significant way to improve customer retention is by providing exceptional, proactive support. Customers appreciate businesses that anticipate their needs and address potential issues before they arise. This can include sending helpful tips, offering follow-ups after a service, or reaching out with solutions before the customer even has to ask. For example, a simple check-in message or automated notification can go a long way in making customers feel valued and cared for.
With ClearlyRated, you can easily monitor customer feedback to identify trends and potential pain points early. The platform helps you stay ahead by alerting you to critical feedback and customer issues so you can resolve them before they escalate. By acting on this feedback quickly, you can turn even detractors into promoters, ultimately improving your customer retention rate KPI.
Leveraging data analytics
Data analytics plays a crucial role in improving customer retention. For example, 76% of businesses have adopted generative AI in 2023, with 46% noting a significant improvement in their overall customer experience, the highest among all age groups. Analyzing customer behaviors, preferences, and feedback helps you gain valuable insights into what drives satisfaction and loyalty.
You need to track key metrics like customer retention rate, average order value, and repeat purchase rate to do this. With this data, you can segment your customer base and tailor marketing efforts, ensuring you target customers with the right incentives. You can also offer personalized promotions or product recommendations that resonate with specific groups by understanding their purchasing habits.
ClearlyRated enhances this process with Gen AI-powered tools that automate the extraction of deeper insights from open-ended feedback. By categorizing sentiment and benchmarking your performance against industry standards, ClearlyRated gives you instant, actionable insights. You can anticipate churn, spot expansion opportunities, and refine your client acquisition strategy. Access to nearly 20 years of industry data ensures you stay ahead of the curve, ultimately improving customer retention.
Drive long-term customer retention through data-driven strategies
To drive long-term customer retention, you need data that shows what works and what doesn’t. Metrics like retention rate, churn rate, lifetime value, and NPS provide valuable insights into your customer relationships. Monitoring these figures reveals where to improve and what actions to take to keep your customers loyal.
Quantitative data like repeat purchase rate or average order value gives you hard numbers to track. Qualitative feedback, however, uncovers the reasons behind customer behavior. When you combine these data points, you can identify both opportunities and challenges.
ClearlyRated makes this process easier by visualizing both types of data. The platform helps you track sentiment, discover trends, and identify customer pain points. You’ll get AI insights that allow you to act quickly on what’s working and what needs attention. When you use data from various sources and work together across your teams, you can make smart, informed decisions that boost customer loyalty and drive long-term growth.
Want to see how this works? Get started with ClearlyRated now and improve your customer retention strategy!
FAQs
What is the most important customer retention metric?
The most important metric is the customer retention rate (CRR). It measures the percentage of customers a business retains over a specific period, indicating customer satisfaction and loyalty.
How often should businesses track retention metrics?
Businesses should track customer retention metrics regularly, whether weekly, monthly, or quarterly. This depends on their customer volume and the specific metrics they're monitoring to identify trends and make informed decisions about retention strategies.
How can small businesses improve customer retention?
Small businesses can improve retention by offering personalized experiences, using loyalty programs, responding promptly to feedback, and creating exceptional customer service.
What tools can help track customer retention?
Tools like ClearlyRated, CRM platforms, and analytics software can help businesses track retention metrics, analyze feedback, and measure customer satisfaction.
How does customer retention impact profitability?
Customer retention drives profitability by reducing churn, increasing repeat business, and enhancing customer lifetime value (CLV). Retained customers tend to spend more, lowering acquisition costs and boosting long-term revenue.
FAQs


%20(1).png)

.webp)
.png)




%5B1%5D.webp)




.png)





_%20The%20Ultimate%20Guide.png)



.png)




%20in%20the%20Workplace.png)


.png)

%20and%20how%20can%20you%20increase%20it.png)
_%20A%20Step-by-Step%20Guide.png)

.png)
.png)


_.png)


%20in%202028.png)


_%20The%20Ultimate%20Guide%20(2024).png)


