Top 9 Customer Experience Metrics to Track in 2026


- Customer experience (CX) metrics help decode how your customers truly feel. From satisfaction to loyalty, these metrics (like NPS, CSAT, CES) reveal what’s working and what’s not—so you can take action before customers churn.
- The right metrics guide smarter decisions and business growth. Tracking CX metrics improves retention, boosts revenue, and helps uncover friction points across the customer journey, leading to better service and stronger brand advocacy.
- Not all metrics serve the same purpose. Use NPS to gauge loyalty, CSAT for specific interactions, CES to detect effort/frustration, and CLV or churn to understand long-term business health.
- Tools like ClearlyRated turn data into actionable insight. Beyond collecting scores, ClearlyRated helps you benchmark, analyze sentiment, and prioritize CX improvements in real-time across teams.
- Turning metrics into action requires cross-functional alignment. Analyze trends, collaborate across departments, and build a roadmap that connects customer feedback to measurable improvements in satisfaction and loyalty.
Customers today hold more power than ever before. A single click or comment can build or break your brand's reputation. So, how do you move beyond guesswork to truly understand what drives their satisfaction, loyalty, and growth? The answer lies in customer experience metrics. These numbers reveal the real story behind every interaction, from moments of delight to points of frustration. Mastering these metrics means you don't just improve service; you transform your entire business by turning casual buyers into passionate advocates and one-time visits into lifelong relationships.
In this blog, you'll discover what CX metrics are, why they matter, how to measure them accurately, and how to use these insights to boost your customer satisfaction and loyalty. Ready to unlock the secrets hidden in your customers' journeys? Let's dive in.
What Are Customer Experience Metrics?
Imagine walking into a store or visiting a website. How easy was it to find what you needed? Did the experience leave you feeling delighted or frustrated?
Customer Experience (CX) metrics are the way businesses capture those feelings and moments across every step of the customer journey. They measure how simple it is to interact with a brand, how enjoyable the experience feels, and how useful the products or services prove to be.
By translating these personal experiences into precise numbers and insights, CX metrics enable companies to identify where the journey excels and where it falls short, helping them create smoother, more memorable experiences that keep customers coming back.
Why CX Metrics Matter: Benefits & Business Impact
Not knowing exactly how your customers feel or why they stay or leave creates a costly blind spot for many businesses. Shrinking loyalty, unpredictable churn, and stagnant growth often stem from a lack of clear insight into the customer journey. Without precise metrics, decisions are often based on assumptions or incomplete data, resulting in wasted marketing budgets, frustrated teams, and unhappy customers.
CX metrics provide a lifeline out of this uncertainty. They serve as early warning systems that detect frustration and friction before they escalate into lost customers or damaging reviews. More importantly, they identify your most valuable customers, the ones likely to stick around, spend more, and become your brand's biggest advocates. This insight helps you tailor strategies and investments for maximum impact.
On the operational side, CX metrics reveal internal inefficiencies that might otherwise go unnoticed. They indicate whether support teams are resolving issues promptly or if bottlenecks are impacting customer satisfaction. Armed with this knowledge, you can optimize processes, improve training, and deliver the faster, more personalized service customers expect.
The business impact is clear. Companies that utilize CX metrics effectively experience higher retention, increased revenue, and stronger brand loyalty. They can innovate more quickly, adapting to changing customer needs and staying ahead of their competitors. Mastering CX metrics is no longer optional; it is a vital factor that separates industry leaders from the rest.
Top 9 Customer Experience Metrics to Track
Tracking the right customer experience (CX) metrics is crucial for understanding customer satisfaction, loyalty, and operational performance. Here's a detailed breakdown of the top 9 CX KPIs every business should monitor, along with practical guidance on how to apply them effectively.
#1 Net Promoter Score (NPS)
Think of NPS as your brand's loyalty meter. You ask customers a simple question: "On a scale of 0 to 10, how likely are you to recommend us to a friend or colleague?"
Their answer divides them into three groups. Those who score 9 or 10? They're your biggest fans, your promoters. They're the ones singing your praises and coming back time after time.
Scores of 7 or 8 are your passives—they're satisfied but not quite shouting your name from the rooftops. And anything six or below? Those are detractors customers who might steer others away. What makes NPS so powerful is that it provides a quick snapshot of your brand's health and loyalty at a glance. Plus, it's easy to compare your score against others in your industry, helping you see if you're leading the pack or falling behind.
Here's the formula in a nutshell: subtract the percentage of detractors from promoters to get a score between -100 and +100.
A quick tip: don't overlook your passives. They're your low-hanging fruit. With the right engagement, these fence-sitters can turn into enthusiastic promoters and supercharge your growth.
NPS works especially well in SaaS, retail, and subscription-based businesses where word-of-mouth can make or break success.
Pro Tip: Ask a follow-up question to understand the reasoning behind your scores. It's the stories customers tell that reveal your biggest opportunities.
#2 Customer Satisfaction Score (CSAT)
CSAT is like a quick mood check after a specific customer interaction. Imagine your Customers just finished a support chat or completed a purchase—how happy are they with that experience? That's exactly what CSAT captures. Instead of waiting for long-term trends, it zooms in on the present moment, allowing you to identify problems or successes at precise points in the customer journey.
The trick is to send these surveys immediately after key touchpoints, such as trial completions, product deliveries, or support conversations. When you combine CSAT with metrics like NPS and Customer Effort Score (CES), you get a full picture: CSAT shows how each interaction fares, NPS tracks loyalty, and CES reveals how easy or hard the experience was.
If you ever see a high CSAT but a low NPS, that's a red flag. It means customers may be satisfied with the service but aren't feeling loyal or excited enough to promote your brand.
CSAT scores often align closely with first contact resolution (FCR) and average handle time (AHT), reflecting the impact of operational efficiency on satisfaction if you have a high CSAT but a low NPS, your customers like the service but may not trust or advocate for your brand.
Pro tip: Utilize cohort analysis to monitor customer satisfaction across various stages of the customer lifecycle. This helps you understand how experiences accumulate over time and where improvements truly matter.
#3 Customer Effort Score (CES)
Sometimes, it's not about delighting customers but simply making things easy for them. That's where CES comes in, measuring the effort required by a customer to complete a task, whether it's resolving an issue or making a purchase. The less effort they expend, the happier and more loyal they tend to be.
What's great about CES is how it cuts through the noise by focusing on friction points that might otherwise go unnoticed. Sending a quick CES survey immediately after a support call or self-service interaction can help highlight where your process is smooth and where it's clunky.
Here's something you might not expect: CES scores often have an inverse relationship with churn. The harder it is for customers to get what they need, the more likely they are to leave. It also directly ties into your NPS, easy experiences breed promoters.
Pro tip: Don't limit CES to support calls. Track customer effort across all digital touchpoints, especially self-service portals and checkout processes, to uncover hidden pain points.
#4 Customer Lifetime Value (CLV)
If you want to play the long game, Customer Lifetime Value is your best friend. It estimates the revenue a single customer will generate over the course of their entire relationship with your brand. Knowing this Number helps you decide how much to invest in keeping customers happy and when to focus on acquiring new ones.
In SaaS, CLV is calculated by multiplying the average revenue per user by the average customer lifespan. For e-commerce, it's a bit more detailed—you multiply the average order value by the purchase frequency and then by the average customer retention time. This helps you identify your high-value customers, allowing you to tailor your marketing and service efforts accordingly. Pair CLV with churn and engagement data to find who's at risk and who's worth extra attention.
One insight that often surprises people is the close connection between CLV and retention. Simply put, the longer customers stay, the more valuable they become.
Pro tip: Utilize predictive analytics to keep your customer lifetime value (CLV) estimates up-to-date and leverage those insights to engage your most valuable customers proactively.
#5 Customer Churn Rate & Retention Rate
Customers don't stay forever, and that's a reality every business must face. That's why Churn Rate and Retention Rate are two sides of the same coin. Churn measures the number of customers who slip away during a specific period, while retention counts the number that stick around, excluding any new additions. Even small shifts in these rates can have a dramatic impact on your revenue, especially in subscription-based models where recurring business is crucial.
However, here's the key: examining overall churn or retention numbers alone only scratches the surface. The real insights come from breaking churn down into cohorts, groups of customers segmented by signup date, product version, or demographics. This lets you pinpoint when and why customers leave, revealing critical moments to intervene with targeted retention strategies. Not all churn is bad; sometimes, losing low-value or unprofitable customers can be a strategic move.
Pro tip: Use churn data to trigger personalized win-back campaigns before customers leave for good.
#6 First Contact Resolution (FCR)
First Contact Resolution is a gold standard in customer support. When you solve a customer's problem on the first try, you not only save time and money but also build trust with them. Customers feel heard and valued, and your operational efficiency improves. FCR tends to track closely with Customer Satisfaction (CSAT), making it a reliable indicator of how well your support team is performing.
Drops in FCR often indicate hidden problems, such as outdated knowledge bases or gaps in training, which can escalate into more significant issues if left unaddressed. Keeping an eye on FCR, alongside metrics such as Average Handle Time and sentiment, gives you a clear picture of whether issues are being resolved effectively.
Pro tip: If you notice FCR suddenly drop, investigate agent workflows and knowledge resources immediately to prevent customer frustration.
#7 Average Resolution Time (ART) / Average Handle Time (AHT)
Average Resolution Time (ART) and Average Handle Time (AHT) are key metrics that measure how quickly your team resolves customer issues and handles interactions. While speed is important, cutting corners to reduce resolution time can backfire by leaving problems only partially solved. Interestingly, longer resolution times on complex issues often signal quality care that strengthens customer trust rather than dissatisfaction.
These metrics closely correlate with Customer Satisfaction Score (CSAT) and customer sentiment. A sudden drop in ART or AHT, accompanied by declining satisfaction, usually indicates that agents are rushing rather than resolving issues effectively. Tracking these together provides a more comprehensive picture of operational efficiency and service quality.
Pro tip: Balance speed with quality by monitoring ART and AHT alongside CSAT and sentiment data to ensure customers feel truly supported.
#8 Sentiment Analysis
Sentiment analysis leverages AI and natural language processing to surpass traditional survey scores and reviews. It reads between the lines to uncover the emotions behind customer feedback across various channels, including social media, emails, and product reviews. One of its biggest advantages is catching early warning signs of trouble before they appear in churn rates or satisfaction scores. By layering sentiment data with metrics like NPS and CSAT, you get a richer understanding of why customers feel the way they do, not just what they say.
While sentiment analysis doesn't have a single formula, its value lies in quantifying emotional trends at scale and integrating them into your broader customer experience (CX) analytics.
Pro tip: Integrate sentiment analysis with customer journey mapping to pinpoint where emotions spike and target those moments with tailored interventions that boost loyalty and reduce friction.
#9 Customer Emotional Intensity
Not all feelings are equal. Customer Emotional Intensity measures how strongly customers feel about their experiences, not just whether they have a positive or negative feeling. Highly emotional customers—whether positively or negatively—are far more likely to become loyal advocates or vocal critics.
You can capture this intensity through specialized surveys or text analytics that analyze language cues and sentiment strength. This insight helps you prioritize cases that need urgent, personalized attention, especially when compared to more general satisfaction scores.
Pro tip: Use emotional intensity data to tailor your outreach. High-intensity negative feedback requires prompt, empathetic responses, while high-intensity positive feedback presents an opportunity to strengthen customer loyalty.
How to Choose the Right CX Metrics (75 words)
Choosing the right CX metrics isn't about trying to track everything; it's about focusing on the key metrics that matter most. It's about focusing on the few that truly drive your business forward. Begin by aligning metrics with your specific goals and the customer journey stages that are most important.
For instance, if your priority is reducing churn, focus on the churn rate and Net Promoter Score (NPS) immediately after onboarding to catch early warning signs. If improving support efficiency is key, prioritize First Contact Resolution (FCR) and Average Handle Time (AHT) to see how quickly issues are resolved.
Sometimes, the most revealing metrics are those that uncover hidden friction, like a sudden jump in Customer Effort Score (CES) during checkout, signaling a snag that could cost you sales.
Remember, context matters. The same metric can tell very different stories depending on your industry and customer base. Your set of CX metrics should evolve, adapting as your business grows and customer expectations shift.
Lastly, ensure cross-functional collaboration so that insights flow freely and drive decisions across marketing, sales, support, and product teams. The secret is choosing metrics that not only report numbers but also highlight actionable insights, giving your teams the clarity they need to make impactful changes and drive real growth.
Tools to Measure Customer Experience Metrics
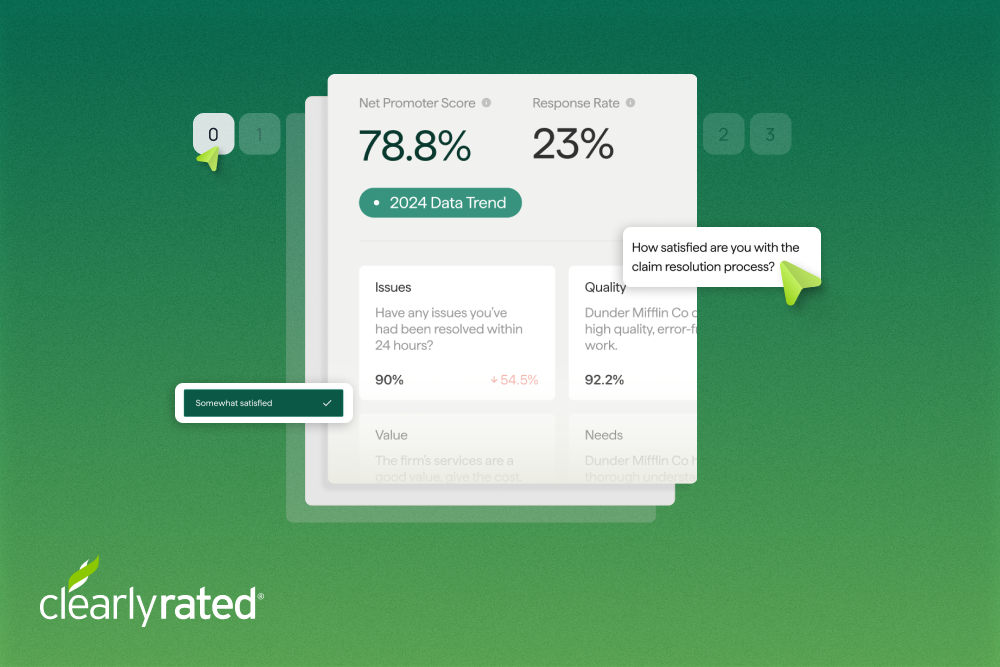
Tracking customer experience metrics, such as NPS, CSAT, and CES, requires tools that do more than collect data. The best platforms provide actionable insights, drive engagement, and integrate seamlessly into your workflow. Here's a quick look at some of the leading CX survey tools, with a focus on how ClearlyRated stands out from the rest.
Among the many platforms available, ClearlyRated stands out as a leader for companies serious about elevating their customer experience. Its streamlined approach to NPS measurement is particularly powerful, offering not just score tracking but deep insights into customer loyalty drivers. ClearlyRated's surveys are designed to maximize response rates with simple, user-friendly formats while providing real-time dashboards that highlight trends and pinpoint areas for improvement.
What sets ClearlyRated apart is its focus on actionable intelligence. Beyond collecting scores, it helps businesses understand the why behind the numbers, making it easier to implement changes that boost satisfaction and retention. With built-in benchmarking against industry standards, companies can assess their performance and set realistic yet ambitious goals. Its integration capabilities mean these insights flow seamlessly into your CRM and analytics tools, empowering teams across marketing, sales, and support to act swiftly.
How to Turn Metrics into Action
Collecting customer experience metrics is just the first step. The real magic happens when you transform those numbers into meaningful action that drives growth and loyalty. Here's how to make that leap effectively.
Analyze Trends, Not Just Numbers
Looking at raw numbers is like reading a single page of a novel; you miss the bigger story. Instead, focus on identifying patterns and trends over time. ClearlyRated's real-time dashboards and benchmarking tools help you spot shifts in customer sentiment early, allowing you to address issues before they escalate. Whether it's a gradual rise in Customer Effort Score or a dip in Net Promoter Score, understanding these trends gives you the foresight to improve the customer journey proactively.
Cross-Functional Collaboration
Customer experience isn't the job of one team; it's a company-wide responsibility. Successful CX initiatives occur when marketing, sales, product, and support teams share insights and collaborate effectively. When your teams collaborate around shared metrics, you break down silos and create a unified front that puts customers first.
Creating a CX Improvement Roadmap
Numbers and collaboration mean little without a clear plan. Utilize your CX data to create a roadmap that prioritizes the most significant improvements. ClearlyRated's in-depth loyalty analysis helps you identify which pain points are costing you customers and which strengths to amplify.
Start with quick wins that boost satisfaction, then tackle deeper issues strategically. A well-defined roadmap keeps your CX efforts focused, measurable, and aligned with your overall business goals.
ClearlyRated: Your Partner for Smart Customer Experience Measurement
Customer experience metrics are the heartbeat of any thriving business. They reveal what keeps customers coming back and what drives them away. But raw numbers alone do not tell the full story. The real value lies in interpreting those metrics to understand the emotions, frustrations, and moments of delight that shape your Customer's journey.
This is where ClearlyRated makes a difference. Designed to capture real-time feedback across critical touchpoints, it empowers businesses to track vital customer experience (CX) metrics, with precision and clarity. Rather than drowning in data, ClearlyRated transforms complex feedback into straightforward insights that highlight what matters most.
Its powerful analytics and benchmarking tools help pinpoint problem areas and uncover opportunities. This gives your teams the confidence to act decisively. The platform's easy-to-read reports reveal customer sentiments and behavior trends that fuel more innovative strategies and more meaningful interactions.
When you use ClearlyRated, you are not just measuring customer experience. You are unlocking the insights that drive fundamental improvements, boost loyalty, and fuel sustainable growth. Book a Demo
FAQ
What is the most important CX metric?
There’s no one-size-fits-all answer, but Net Promoter Score (NPS) often takes the spotlight because it directly measures customer loyalty and advocacy. However, the most important CX metric depends on your business goals and customer journey stage. For immediate feedback, Customer Satisfaction Score (CSAT) works well. To understand effort, Customer Effort Score (CES) is key. The best approach is to track a balanced set of metrics tailored to your unique needs.
How often should I measure customer experience?
Frequency depends on the type of interaction and your business model. For transactional metrics like CSAT or CES, measuring after each key touchpoint,like a purchase or support call provides real-time insights. NPS is typically tracked quarterly or biannually to monitor loyalty trends. The goal is to collect enough data to spot meaningful patterns without overwhelming customers with surveys.
How do I act on poor CX scores?
Poor CX scores are your wake-up call. Start by digging into the feedback to identify root causes, are there specific pain points or common themes? Engage your teams across departments to address these issues quickly, whether it’s improving product features, training staff, or streamlining processes. Then, communicate changes to your customers and follow up with those who had negative experiences to rebuild trust. Turning poor scores into action fuels continuous improvement and customer retention.

FAQs


.webp)


.png)

%20(1).png)

.webp)
.png)


%5B1%5D.webp)


.png)


_%20The%20Ultimate%20Guide.png)


.png)


%20in%20the%20Workplace.png)


.png)

%20and%20how%20can%20you%20increase%20it.png)
_%20A%20Step-by-Step%20Guide.png)

.png)
.png)

