Net Promoter Score (NPS): The Ultimate Guide (2026)


- Referrals remain the most powerful client acquisition tool for accounting firms, far outperforming channels like social media or events.
- Prioritize asking high-value, long-term clients and influential stakeholders who understand and advocate for your services.
- Time referral requests around key milestones such as successful project completions, positive feedback, or service expansions.
- Simplify the referral process with pre-filled templates, integrated workflows, and incentives that match the value of the client.
- ClearlyRated empowers firms to systematize feedback, identify promoters, and convert satisfaction into scalable referral growth.
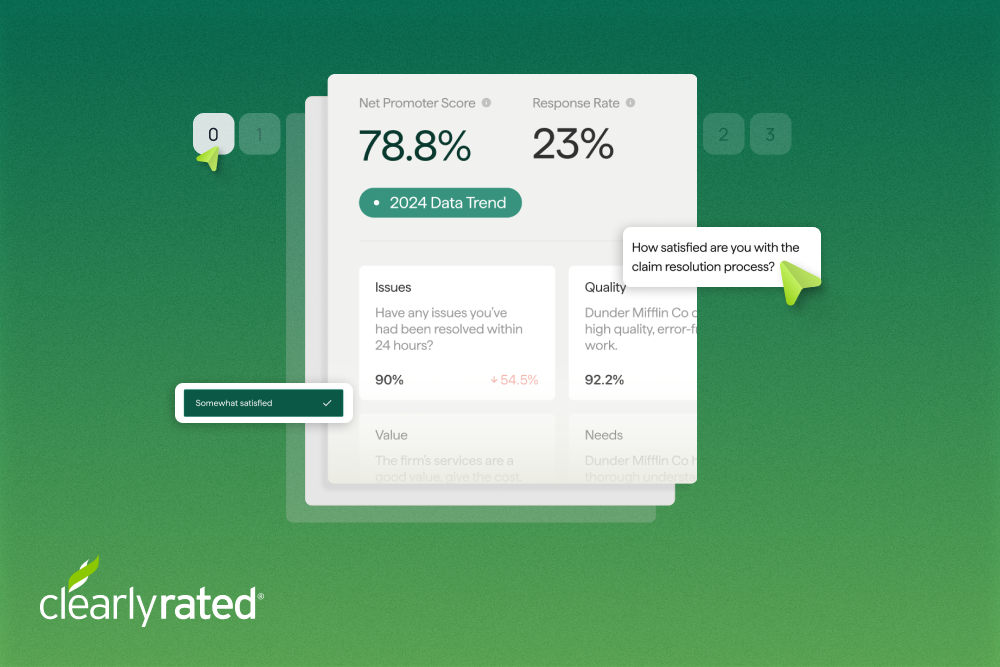
Most of us have seen this screen in our inboxes or apps:

This straightforward question unlocks one of the biggest insights needed for any business to function: customer satisfaction.
Measuring customer satisfaction is crucial for understanding retention and brand loyalty. When customers are satisfied, they're more likely to stay loyal to your brand, which helps reduce churn rates and drives sustainable growth.
So, how can you tell if your customers are truly satisfied with your service? That’s where the Net Promoter® Score (NPS®) comes into play.
In this guide, we’ll dive into the key concepts, calculations, and best practices for leveraging Net Promoter Score in 2025 and beyond. We’ll also discuss methods for analyzing NPS data and strategies to enhance customer loyalty and fuel business growth.
What is Net Promoter Score (NPS)?
Net Promoter Score (NPS) measures customer satisfaction by gauging how happy customers are with your brand. You can conduct NPS surveys through various channels, like email or in-app notifications, tailored to your industry’s needs. The central question is straightforward: "How likely are you to recommend our business to a friend or colleague?" Customers respond on a scale from 0 to 10.
The ratings are then aggregated, resulting in a score that ranges from -100 to 100. The higher the score, the more likely customers are to promote your business to others.
For efficient survey management and data analysis, many businesses rely on NPS Tools.
NPS stands out from other metrics like Customer Effort Score (CES) and Customer Satisfaction Score (CSAT). While CES focuses on how easy it is for customers to use your service and CSAT measures their satisfaction levels, NPS is regarded as the gold standard for evaluating customer loyalty and satisfaction due to its simplicity and effectiveness.
NPS provides valuable insights into your customers’ behaviors and can predict their likelihood to purchase or refer others, helping you enhance the customer experience and boost retention.
Why is NPS important?
The ultimate goal of NPS is to monitor customer satisfaction and identify areas for improvement, but it does a lot more than that.
Helps understand customer sentiments and loyalty
NPS not only measures customer sentiment but also segments customers into three categories: detractors, promoters, and passives. This breakdown allows businesses to pinpoint actionable feedback and focus on areas needing improvement. It drives customer advocacy programs by nurturing satisfied customers into brand champions while empowering support and success teams to effectively tackle challenges faced by less satisfied clients.
Utilizing NPS provides numerous NPS Benefits, including improved customer retention and reliable performance metrics.
Furthermore, companies with a high NPS are likely to record increased referrals, high customer retention rates, and stronger brand loyalty.
Predicts business growth
Companies with a high NPS are likely to record increased referrals, high customer retention rates, and stronger brand loyalty. According to our benchmarks, the accounting industry recorded an all-time high in NPS in 2023, owing to meeting SLAs for emails/calls, and delivering results within established timelines. This, coupled with excellent service quality, further helped retain customers and fueled business growth in this sector. Additionally, our research into staffing firms revealed a $1.4M revenue growth opportunity for firms when they run dedicated NPS programs.
This type of predictable revenue/revenue potential is crucial for financial stability. It allows for better resource planning, like staffing adjustments and service expansion. It also supports long-term growth by keeping cash flow consistent, thus letting firms invest in new areas of growth.
How to calculate Net Promoter Score
To calculate Net Promoter Score (NPS), you classify survey responses to a specific question asking how likely customers are to recommend your company on a scale of 0–10. Customers fall into three groups based on their score namely, promoters, passives and detractors.
Net Promoter Score = (Percentage of Promoters - Percentage of Detractors). This score can range from -100 to 100.

For instance, if 75% of customers are Promoters, 15% are Passive, and 10% are Detractors, your NPS score would be 75 - 10 = 65.
How to interpret Net Promoter Score
Net Promoter Score (NPS) delivers clear feedback on customer sentiment by categorizing responses into three groups: promoters, passives, and detractors. Understanding where your score stands, how it compares to others in your field, and what is considered negative or positive guides your next steps.
A negative NPS indicates more detractors than advocates and vice versa for a positive score. However the average NPS varies greatly based on your industry.
Let's quickly look at what each term means:
Promoters
Promoters are your customers who give you a 9 or 10 on your NPS survey. They’re not just satisfied—they’re enthusiastic about your product or service, and they’re likely to recommend you to others. These are the people who drive positive word-of-mouth and contribute to growth by bringing in new customers, often at no extra cost to you.
While they pose a low risk of churn, happy customers need attention as well. Engaging with promoters consistently can solidify their loyalty and turn them into advocates for life. Create opportunities for them to be brand ambassadors—offer exclusive perks, invite them to provide feedback on new features, or give them early access to product launches. Acknowledging their support not only makes them feel valued but also encourages them to keep spreading the word about your brand.
Passives
Passives score a 7 or 8 on your NPS survey, meaning they’re somewhat satisfied but not fully sold on your services. They’re sitting on the fence, and if a competitor offers a better deal, they might jump ship.
If you’ve looked closely at the NPS formula, you’ll notice passives don’t directly affect your score, which is why they’re often overlooked. But they're the group you can influence most. By addressing their concerns, improving their experience, and making them feel valued, you have a real shot at turning them into promoters. Engage with them through personalized follow-ups, ask for feedback, and offer small but meaningful incentives like exclusive content or early access to new features. It’s about showing them you’re listening and committed to making things better.
Detractor
Detractors are those who give you a score between 0 and 6 on your NPS survey, and they’re the customers most dissatisfied with your service. They’re more likely to leave, and worse, they can actively hurt your brand by sharing negative feedback with others. For actionable strategies on turning these challenging responses into opportunities for growth, refer to our guide on nps detractor.
Detractors can feel like a lost cause, but they’re actually a huge opportunity to make meaningful improvements. The key is reaching out directly, listening carefully to their frustrations, and taking swift, concrete actions to fix the issues that matter most to them. By addressing their pain points and showing that you genuinely care about their experience, you can turn things around. In some cases, this level of personal attention and effort can even convert a detractor into a loyal promoter—someone who not only sticks with you but starts advocating for your brand.
What is a good NPS score?
Here’s a quick breakdown:
- Above 0: This means you’ve got more promoters than detractors, but there’s still a lot of room to grow.
- Above 20: Favourable, but there’s definitely room for improvement.
- Over 50: This is excellent. You’re doing things right!
- Above 70: You’re in world-class territory and usually found only in brands with exceptional service, such as Apple or Tesla—this is as good as it gets.
.png)
What is a bad NPS score?
Here's a quick breakdown:
- Below 0: This means you have more detractors than promoters. It’s a sign that customer satisfaction is a concern, and many customers may be unlikely to recommend your service.
- Between -100 and 0: Negative scores often indicate common issues like unresolved complaints, poor product experiences, or ineffective customer service. It’s crucial to identify and address the root causes quickly.
- Important: If your NPS is low, act fast to address customer concerns and monitor changes over time. Even a small increase can signal meaningful progress.
Comparing your NPS by industry
At ClearlyRated, we’ve been helping service firms track their NPS since 2010. Over the years, we’ve consistently benchmarked NPS across various industries in the US. Below are the benchmarks for the top three industries we work with, based on our 2023 report.
How to conduct NPS surveys and gather customer feedback
There are multiple channels through which you can gather responses for your NPS survey, depending on how extensive/simple the survey.
Pop-up surveys on website / mobile apps
Pop-up surveys are an excellent way to gather customer feedback in real-time. You can set the NPS survey to appear on key pages, like the “thank you” page, where customers can see it right after making a purchase. For instance, Uber collects feedback immediately after every ride, ensuring they capture fresh impressions. Additionally, you can implement it as an exit survey when customers attempt to leave your website, giving you valuable insights just before they go.
The disadvantage here is that you cannot pose multiple questions, or questions that are qualitative in nature as it adds friction for your customers.
Email surveys
You can also choose to collect NPS feedback through emails, inviting customers to fill out a survey after they make a purchase or interact with your brand.
While email surveys require a bit more effort from customers to open and click through, they offer the advantage of allowing customers to reflect on their experience with your product or service in their own time. This can lead to more thoughtful responses and a clearer picture of whether they would recommend you to others. On the downside, email surveys can have lower response rates since customers might overlook or forget to complete them. Additionally, email surveys are typically more detailed, which can make them more time-consuming for respondents.
Phone Calls
Conducting NPS surveys over the phone adds a personal touch that can lead to richer feedback. By speaking directly with customers, you can ask follow-up questions and clarify their responses in real-time. This interaction allows you to dive deeper into their experiences, providing valuable insights into both their satisfaction levels and any pain points they may have encountered.
Moreover, phone calls often result in higher engagement rates compared to written surveys, as customers may feel more inclined to share their thoughts when speaking with a representative. Just be sure to communicate the purpose of the call clearly and respect their time—after all, it’s about creating a dialogue, not a sales pitch. Following up on their feedback afterward can also help build stronger relationships, showing customers that their opinions matter.
A disadvantage of phone calls is that they are time-consuming and resource-intensive. Some clients might find them intrusive.
Face-to-Face Interviews
NPS feedback collected in person is very different because of the dynamic and interactive setting. When you meet with clients face-to-face, you can gauge their physical reactions, which can add layers of understanding to their feedback. This method fosters a sense of connection and openness, allowing customers to feel more comfortable sharing their genuine thoughts.
While this approach might require more logistical planning, such as scheduling and location considerations, the depth of feedback you can obtain makes it well worth the effort. Plus, this direct engagement can leave a lasting impression, reinforcing customer loyalty and trust in your brand.
On the flip side, organizing in-person interviews can be challenging and resource-heavy. They require more time for scheduling and travel, which may not be feasible. Additionally, some customers may feel uncomfortable in a face-to-face setting, which could lead to guarded responses that don’t fully capture their true feelings.
For additional guidance on constructing your survey, consider reviewing our guide on NPS Survey Questions.
Step By Step Process To Create an NPS Survey
Most NPS programs are run with trusted partners like ClearlyRated. Regardless of your choice of service provider, we’ve covered the best practices to ensure that your NPS surveys get the maximum responses.
To build an effective NPS survey, you need to structure your questions carefully. Each part should be clear, concise, and focused on collecting actionable feedback from your customers.
Demographic questions
Start your survey by asking basic demographic questions. This helps you segment responses and see how different groups rate your product or service.
Typical demographic fields include age, gender, location, or role (e.g., decision-maker, end user). Keep these questions optional to avoid survey fatigue. Use dropdowns or multiple-choice formats for faster completion.
Example demographic questions:
- What is your age range? (18-25, 26-35, etc.)
- What is your primary role? (Buyer, User, Manager)
- Where are you located? (Country, State)
Collecting this information lets you spot trends and tailor improvements for specific customer segments.
The Net Promoter Score question
At the core of every NPS survey is the standard NPS question:
"On a scale of 0 to 10, how likely are you to recommend [Your Company] to a friend or colleague?"
Make this item stand out in the survey, often with a numeric scale displayed horizontally. This is a single-select question, not open-ended. Respondents choose one number.
Remind respondents that 0 means "not at all likely" and 10 means "extremely likely." Avoid additional explanation or wording that could bias their response.
What’s the reason for your score?
Immediately follow the NPS question with an open-ended prompt. Ask, "What is the primary reason for your score?"
This lets customers explain their rating in their own words. Avoid leading questions or suggested answers—keep it blank for a free-form response.
Use this feedback to identify common drivers of satisfaction or dissatisfaction. Analyze qualitative trends alongside your NPS data to uncover issues and opportunities.
Encourage honest feedback by reminding customers that their responses help shape your product or service. Keep this question optional, so it doesn’t deter survey completion.
How can we make your experience better?
Add a second open-ended question focused on improvement. "How could we improve your experience?" or "What would make you more likely to recommend us?" are effective phrasings.
This helps you gather actionable suggestions. Some respondents who gave a score below 9 will provide specific ways you can address their pain points.
Review these entries regularly. Group similar feedback to prioritize new features, support changes, or process improvements.
Allow plenty of space for input, and do not limit the word count unless necessary. If using digital surveys, enable multiline text fields for longer answers.
Permission to follow up with the customer
End your survey by asking if respondents are open to follow-up contact. Phrase this as a clear yes/no or opt-in checkbox.
Sample wording:
"May we follow up with you to discuss your feedback further?"
Collect an email address or confirm the one linked to their account, but only if they agree to further contact. This ensures compliance with privacy laws and builds trust with your respondents.
You can use a simple checkbox such as:
- Yes, you may contact me about my feedback
Keep this question brief and direct. Clearly state how follow-up will be used, and thank them for their participation regardless of their answer.
How to read your NPS results
Understanding your Net Promoter Score (NPS) requires more than just knowing the number. To gain real insights, you should analyze your data by segment, monitor trends, and respond directly to feedback.
Look at data segments
Breaking down your NPS by segments such as customer type, region, or product category makes patterns clearer. For example, B2B customers might have a higher score than B2C, or one product line may consistently receive lower ratings. You can use a table like this to compare scores:
This approach helps you focus improvement efforts and identify which groups are most satisfied or at risk of leaving. It also provides context to your overall score, so you avoid acting on averages alone. Filtering results this way often reveals issues otherwise hidden in aggregate data.
Keep tracking performance over time
A single NPS snapshot gives you limited insight. Regular measurement over months or quarters allows you to detect whether satisfaction is improving or declining.
You should visualize your NPS data using a simple line chart to spot trends and patterns:
- Sudden drops may indicate product issues, poor service, or changes in customer experience.
- Consistent rises likely point to successful improvements or increased customer loyalty.
Be sure to tie changes to specific actions or events, such as a new product launch or support initiative. This way, you can see what affects your score, and make data-driven decisions going forward.
Close the loop
Actively responding to feedback given in your NPS survey helps demonstrate that customer input matters. When detractors leave comments, contact them to understand their frustrations and work to resolve issues. For passive respondents, ask for suggestions to move them into promoter status.
You can automate this process with follow-up emails or calls. Here’s a useful checklist:
- Respond to every detractor within a set time frame.
- Log feedback for future improvements.
- Track resolution outcomes to measure impact.
This approach not only improves individual relationships but can help boost your overall NPS when customers see their voices lead to real change.
Using NPS survey responses as input into a customer churn model
Net Promoter Score (NPS) survey responses are often used as input features in customer churn models. By combining NPS data with other behavioral and demographic metrics, you can gain a more comprehensive view of customer sentiment and predict the likelihood of churn.
NPS ratings can be encoded as numerical values or categorized (e.g., Promoters, Passives, Detractors). You might use a table like the one below for feature engineering:
Including NPS verbatim comments as text features is also possible. You can use basic sentiment analysis or keyword extraction to convert qualitative feedback into model inputs.
You should regularly update your model with fresh NPS data. This helps in capturing shifts in customer attitudes over time. When training your churn model, ensure NPS responses are aligned with the time frame of your other customer activity data.
Common machine learning techniques for this purpose include logistic regression, decision trees, and random forests. You can monitor feature importance metrics to see how NPS scores affect churn predictions compared to other variables.
In practice, using NPS responses in churn modeling often helps you identify dissatisfied customers earlier and take targeted action. This integration improves the precision of retention strategies without requiring major changes to existing survey processes.
Common mistakes to avoid when using Net Promoter Score
While using the NPS method is straightforward, several common pitfalls can impact the effectiveness of your surveys.
Asking Too Many Questions
While it’s tempting to gather as much feedback as possible, bombarding customers with too many questions can lead to frustration. Each additional question can drop your response rate by up to 10%. To achieve a high response rate, keep the survey simple and quick. Ensure it’s mobile-friendly, and consider embedding it in a personalized email rather than just sending a plain link.
Focusing Exclusively on the Score
Brands that pay attention to customer feedback are 1.6 times more likely to achieve high satisfaction rates. However, this only happens when they genuinely listen to customers and act on their feedback. Many businesses fall into the trap of solely measuring and calculating their NPS, neglecting the valuable insights that customer comments provide. Use the NPS score as a starting point, but dig deeper to understand what drives customer satisfaction and identify areas for improvement.
Overlooking Data Segmentation
While the NPS score gives you a snapshot of customer loyalty, it’s crucial to segment the data by demographics, feedback, and product usage. This approach helps reveal patterns and trends that the overall score might obscure, preventing wasted time and resources on issues that don’t matter to specific groups. Analyzing NPS data by segments allows you to identify strengths and weaknesses, enabling you to tailor your strategies to meet the specific needs of different customer groups.
NPS Case Studies
The NPS score drives growth, and this can be seen in a couple of industries. Here are two success stories from companies that have benefited from NPS.
Essential: StaffCARE (ESC):

ESC, a leading provider of ACA-compliant health insurance and employee benefits, faced the challenge of quantifying the service it provides to customers.
ESC worked with ClearlyRated to gather feedback from their entire customer base. The outcome was a 74% NPS in their first annual survey, a world-class score based on the global NPS standards.
“We saw the amazing impact that ClearlyRated’s Net Promoter® Score survey program has had in the staffing industry, and we knew that the same benefits were applicable in our business. We had been looking for an opportunity to invest in an independent, third-party feedback system to more thoroughly understand how our clients view ESC. We saw how the ClearlyRated solution could bring more credibility to our message while allowing us to drill down much deeper on our successes and areas for improvement.”
– Aaron Lesher
Executive Vice President at Essential StaffCARE
Woodruff Sawyer:
.png)
Since 2014, Woodruff Sawyer's has maintained its exceptionally high NPS with the most recent being 86.1%. This figure exceeds the insurance industry average of 34%. NPS survey results have enabled them to identify detractors and curate service-oriented approaches to address these issues before they escalate and lead to revenue loss.
“Our team is passionate about serving clients and helping them succeed. When we launched our first ClearlyRated survey, we took our first step towards a formal, direct feedback mechanism. We used the survey to understand: Are we delivering an outstanding experience? Where are we doing well? Where are we not?”
– Melinda Miu
Woodruff Sawyer’s Assistant Vice President of Marketing
Integrating NPS Into Your Business Strategy
Incorporating NPS into your business processes goes beyond just collecting scores; it’s about actively using customer feedback to drive informed decisions and implement improvements. This means identifying pain points from survey data, developing actionable plans to address these challenges, and effectively communicating those plans with your team.
By taking customer feedback seriously and showing tangible improvements over time, businesses can boost customer satisfaction and loyalty, giving them a competitive edge.
If you’re looking for a starting point, the ClearlyRated CX program provides a reliable method to assess customer loyalty through NPS surveys. This platform helps you pinpoint friction points in the customer experience, allowing you to make informed decisions and implement changes that align with your goals.
Schedule a demo to see how ClearlyRated can help you improve your NPS score.
FAQs on Net Promoter Score (NPS)
How often should I send NPS surveys to customers?
The frequency of NPS surveys depends on your business, but generally, relational NPS surveys should be sent quarterly or semi-annually. This timing helps you effectively track customer satisfaction and loyalty over time without overwhelming your customers with too many requests. However, if the nature of your business necessitates a higher frequency of customer feedback, ClearlyRated has options for you to run that each week.
Who uses Net Promoter Score?
Net Promoter Score is widely utilized across various industries to gauge customer satisfaction and loyalty. This includes sectors like technology, finance, legal, IT, telecommunications, staffing, accounting, and HR services. Essentially, if you value customer feedback, NPS is a great tool for you!
Is NPS capable of forecasting business growth?
Absolutely! NPS can serve as a valuable indicator of future business growth. It provides a comprehensive view of your customer experience, where high scores often correlate with increased satisfaction, lower churn rates, and overall business expansion.
How can I improve my NPS score?
To enhance your NPS score, focus on addressing customer feedback. This means analyzing the insights you receive, closing any gaps in service, engaging with your promoters, tracking your progress, and consistently delivering a positive customer experience. By doing so, you'll not only boost your score but also strengthen customer loyalty.
FAQs


.webp)


.png)

%20(1).png)

.webp)
.png)


%5B1%5D.webp)


.png)


_%20The%20Ultimate%20Guide.png)


.png)


%20in%20the%20Workplace.png)


.png)

%20and%20how%20can%20you%20increase%20it.png)
_%20A%20Step-by-Step%20Guide.png)
