Measuring Customer Experience: 8 Metrics to Do It Right

- Customer experience (CX) is the new competitive edge. It's not just about product quality—how customers feel across every interaction can make or break loyalty.
- Measuring CX is critical. Metrics like NPS, CSAT, CES, churn rate, and CLV help track satisfaction, identify service gaps, and improve customer retention.
- Use the right tools. Platforms like ClearlyRated make it easy to collect feedback, benchmark performance, and act on real-time insights.
- Don’t stop at metrics—act on them. Use data to personalize interactions, enhance employee training, streamline support, and fix problem areas.
- Avoid common mistakes. Relying on a single metric, ignoring customer comments, or failing to act on feedback weakens your CX strategy.
How do you win new customers? Most businesses will say it’s the quality of their products or services. But today’s customers expect more. They’re choosing companies based on their experiences. In fact, 81% of organizations consider customer experience (CX) a key competitive differentiator.
Consider this:
- 42% of people who had a bad customer service experience felt disappointed.
- 43% were unhappy.
- 41% were outright angry.
But the impact doesn’t stop there. Sixty-seven percent shared their negative experience, and 65% switched brands. In contrast, after a positive customer service experience, 43% of people are more likely to buy again.
To build a loyal customer base, service quality must be a priority. That starts with setting clear customer service standards—and creating reliable ways to evaluate the customer experience. Then, regularly measure how customers feel and identify gaps in your delivery.
Next, we’ll explore eight key metrics for measuring customer experience, retention, and loyalty.
What Is Customer Experience?
Customer experience (CX) captures how customers feel and respond to every interaction with your brand. It includes all the touchpoints they engage with, such as browsing your website, speaking with your customer service team, or visiting your physical store. Every moment, from discovery to post-purchase support, shapes their perception.
CX combines emotional and practical elements. Emotions range from satisfaction to frustration, depending on how customers feel when interacting with your brand. Practical elements reflect how easily they can navigate your site, place orders, or reach support.
No matter what industry you work in, improving customer experience drives higher retention, better satisfaction, and stronger revenue.
Why Measuring Customer Experience is Critical
Now that we’ve discussed the key elements of customer experience, let’s look at why measuring it is essential for your business success and long-term customer loyalty.
It builds loyal customer relationships
When you understand customer preferences, you personalize their journey and create emotional connections that make them feel valued. Stronger emotional bonds naturally boost loyalty and encourage customers to keep choosing your brand over others. Over time, loyal customers turn into passionate advocates who drive referrals, repeat business, and a steady flow of positive reviews.
Personalization plays a major role in keeping customers engaged and loyal to your brand.
Sixty-eight percent of customers will spend more with a brand that treats them like individuals. Seventy-nine percent found value in chatting with customer service reps online, while 75% appreciated engaging with other customers in a brand’s online community.
It increases sales, leading to revenue growth
The market is crowded with businesses vying for customer attention. But many still underestimate the power of a great customer experience. Eighty-three percent of consumers say good customer service influences their buying choices, highlighting the importance of measuring customer experience.
Customer experience evaluation gives you a clear picture of your position compared to your competitors. It helps you identify gaps in your service, highlight areas where you can outperform others, and find opportunities your competitors might miss.
8 Key Metrics for Measuring Customer Experience
You need to know how to measure customer experience to enhance it. Here are the key metrics you need:
1. Net Promoter® Score (NPS®)
After buying from a particular brand, most of us have seen this question on websites or apps:
"How likely are you to recommend our brand to a friend or colleague?"
You can gain crucial insight into customer satisfaction by asking this simple question.
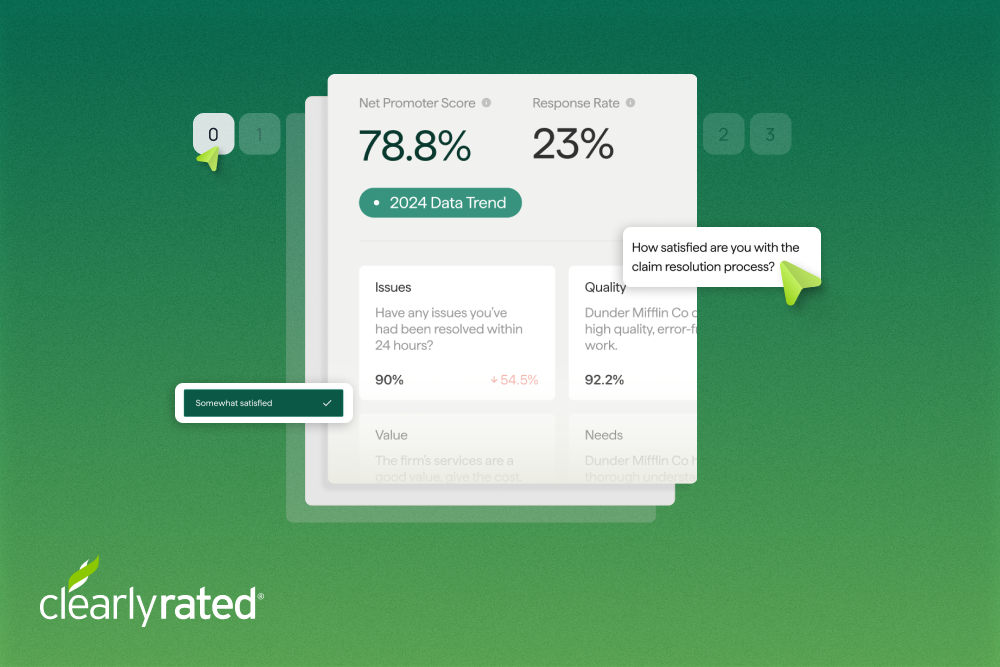
Net Promoter Score (NPS) measures how happy your customers feel about your brand through direct feedback. You can collect NPS data through surveys sent by email, in-app notifications, or any channel that fits your industry.
You ask customers to rate their experience on a scale of 0 to 10 and group them based on their scores:
- Promoters, who score 9 or 10, stay loyal and often recommend your brand to others
- Passives, who score 7 or 8, feel satisfied but show little enthusiasm to advocate for you
- Detractors, who score between 0 and 6, feel unhappy and may damage your brand’s reputation
To calculate NPS, subtract the percentage of Detractors from the percentage of Promoters.
Your score can range from -100 to 100. Higher scores indicate stronger customer loyalty and advocacy.
For example, if 75% of customers are Promoters, 15% are Passives, and 10% are Detractors, your NPS would be:
NPS = 75% (Promoters) - 10% (Detractors) = 60
You can also use NPS software and customer experience measurement tools like ClearlyRated to make the process easier. These platforms help you collect feedback, benchmark your scores against industry standards, and track your performance over time.
ClearlyRated’s 2024 Benchmarks reported that the IT services industry hit its highest NPS of 55% in 2024.

Though progress is evident, IT services companies still have room to improve compared to global standards. A score of 50% is good, while anything above 70% is excellent. Brands like Starbucks (77%) and USAA (75%) lead in customer satisfaction, while companies like Comcast struggle with a -25% NPS.
This presents both a challenge and an opportunity for service providers. As customer expectations evolve, companies that fall behind will face difficulties. However, those that improve their NPS can gain a significant competitive advantage.
2. Customer satisfaction score (CSAT)
Like NPS, businesses gather customer satisfaction (CSAT) scores through simple, one-question surveys that reduce survey fatigue.
A typical CSAT question is: “How satisfied were you with your experience today?” Customers respond with options like “Satisfied” or “Dissatisfied,” and may leave comments for added context.
To calculate CSAT:
CSAT = (Number of Satisfied Customers / Total Responses) x 100
For example, if 80 out of 100 customers rate their experience as “satisfied” or “very satisfied,” your CSAT score would be 80%.
CSAT surveys are usually sent after a support interaction but can measure satisfaction across various touchpoints.
Why CSAT matters:
- Identify pain points: Real-time feedback highlights issues in processes like checkout or support.
- Measure employee performance: Helps assess customer service team effectiveness.
- Track customer perceptions: Gauges the impact of changes to products, services, or your website.
A high CSAT score shows your business is meeting expectations, driving loyalty through consistently positive experiences.
3. Customer effort score (CES)
Customer effort score (CES) measures how easy it is for customers to complete tasks—like making a purchase, finding information, or getting support.
A simple post-interaction survey might ask: “How easy was it to resolve your issue today?”
CES can be measured using:
- Likert scales: Customers agree or disagree with statements such as, “It was easy to get help.” This scale provides a broad view of effort.
- Numeric scale: A scale from 1 to 5 or 1 to 10 allows customers to precisely rate their experience.
- Emotion scale: A visual representation using emojis helps capture customers' emotional responses, providing clearer insights into their perceived effort.
However, the standard way to measure CES is by averaging customer responses from the survey. For example, if you ask customers to rate their experience on a scale from 1 to 5 (with 1 being very difficult and 5 being very easy), the formula would look like this:
CES = (Sum of customer scores) / (Total responses)
A low CES score means customers feel they had to put in more effort during their experience. A higher CES signals less friction, showing that your service feels easier and more efficient to them.
4. First contact resolution (FCR)
First contact resolution (FCR) measures the percentage of customer issues resolved during the customer's first interaction with your support team via phone, email, or chat.
Here’s how you can calculate FCR:
FCR = (Number of issues resolved on first contact / Number of total issues) * 100 = FCR%
For example, if your customer support handled 500 problems in a time frame and 400 of those problems were resolved at the first contact, your FCR would be 80%.
This means 80% of customer problems were resolved at the first point of contact. This is a good indicator of effective customer service, although there’s some scope for further improvement to reach a greater resolution rate.
Why FCR matters:
- Customer satisfaction: A higher FCR indicates faster problem resolution, leading to improved satisfaction.
- Operational efficiency: Resolving issues on the first contact reduces follow-ups, saving time and lowering costs.
- Brand loyalty: Effective resolution enhances customer trust and retention.
5. Average resolution time (ART)
Also known as average time to resolution, average ticket resolution time, or mean time to resolution (MTTR), the average resolution time (ART) measures how long it takes to resolve a customer’s issue fully. This metric plays a critical role in overall customer satisfaction, as the quicker a problem is resolved, the better the customer experience.
ART considers the entire process from the moment a customer reaches out to support until their issue is completely addressed and the ticket is closed. Efficient resolution times contribute to a positive, frictionless experience, while delays can lead to frustration and a negative impact on customer loyalty.
Formula for ART:
ART = Total resolution time for all tickets / Total tickets resolved
Example:
If 100 tickets take 200 hours to resolve,
ART = 200 / 100 = 2 hours per ticket
That means the average time for resolving each ticket is two hours.
A lower ART means faster issue resolution and happier customers. A higher ART can signal delays, leading to frustration—and potential churn. To reduce ART, spot recurring issues and create quick solutions like knowledge base articles or pre-written responses that help your team move faster.
6. Churn rate
The customer churn rate refers to the percentage of customers who stop using your product or service within a specific time frame.
It’s a crucial metric because it directly impacts customer retention and the overall growth of your business. A high churn rate indicates that customers leave at an unsustainable pace, threatening long-term profitability and growth.
To calculate churn:
Customer churn rate = [Customers lost during the period/ Total customers at the start of the period] ×100
Let’s say your business started the month with 500 customers, and by the end of the month, 50 customers had left. The churn rate for the month would be:
50/500 * 100 = 10%
In this case, 10% of your customers churned within the month.
Depending on your business model, you can track churn rate over different periods (weekly, monthly, annually). Regularly measuring churn allows you to identify trends, understand customer behavior, and uncover the reasons behind dissatisfaction.
Many businesses can tolerate an annual churn rate of 5-7%. However, any rate higher than that signals a potential issue.
In that case, you can reduce the churn rate by:
- Enhancing customer support: Quick and effective support can quickly address problems, stopping customers from leaving.
- Regularly engaging customers: Connecting with customers through frequent check-ins, tailored promotions, and content that delivers value can increase loyalty.
- Improving the onboarding process: Seamless onboarding guarantees that customers experience value early, minimizing the risk of early churn.
As a powerful client experience management platform, ClearlyRated helps businesses improve customer retention and reduce churn by providing a real-time, 360-degree view of customer satisfaction. With ClearlyRated, you get actionable insights from customer feedback, allowing you to address issues proactively before they escalate.
7. Customer lifetime value (CLV)
CLV is one of the most important metrics for customer experience tracking. It estimates the total revenue a business can expect from a customer over their entire relationship with the brand.
CLV = Average purchase value × Average purchase frequency × Customer lifespan
If a customer spends $100 per month on your product, buys it once a month, and stays for two years, their CLV would be:
CLV = 100 × 12 × 2 = 2,400
A higher CLV suggests that customers are satisfied, loyal, and engaged, indicating a positive customer experience. It helps businesses focus on the value delivered over time, rather than just short-term transactions.
When you calculate CLV, you can:
- Know who your most valuable customers are, which enables you to tailor CX strategies specifically to them
- Decide where to invest in customer service, loyalty programs, and other initiatives that enhance the customer experience
- Gain a positive long-term customer relationship, and by improving CX, you can further increase the lifetime value of your customers
8. Retention rate
Retention rate measures the percentage of customers a business retains over a specific period. High retention rates often result from positive CX efforts, while low retention can indicate problems in customer satisfaction, product quality, or service delivery.
To calculate the retention rate, use this formula:
Retention rate = (E-N)/S * 100
Where:
- E = Number of customers at the end of the period
- N = Number of new customers acquired during the period
- S = Number of customers at the start of the period
For example, if you start the quarter with 500 customers, acquire 100 new ones during the quarter, and end with 450 customers, your retention rate is 70%.
Retention rate directly reflects how well your customer experience strategies are working. It indicates the effectiveness of your efforts to maintain customer satisfaction and build long-term relationships.
A high retention rate also suggests customers are happy, loyal, and see value in staying with your brand.
Best Practices for Measuring Customer Experience
Effective measurement means knowing where to focus, what to track, and how to analyze results. You must constantly improve how you engage with your customers to stay ahead of their needs.
Here’s a breakdown of the best practices for measuring CX and what they can tell you about your customers.
Utilizing omnichannel analytics
Customers often interact with brands across multiple channels before making a purchase. They may check your website, ask a question on social media, or visit your physical store. If you track customer interactions only on one platform, you miss the full picture of your customers' journeys.
Analyzing these multiple touchpoints provides a comprehensive view of your customer’s experience. It also helps you uncover gaps, such as slow response times on social media or a confusing website layout, that could negatively impact your CX.
Customizable dashboards and reporting
Customer experience is personal. Different teams need to see different data. A single approach won’t work when tracking CX metrics. NPS dashboards allow you to focus on the most important aspects of your business by asking questions such as:
- Do you want to track overall satisfaction?
- How is your support team performing?
- Would you like to dive into product-specific feedback?
You can create different reports for different departments, whether it's sales, marketing, or customer service. Customizing these reports lets each team easily track performance and see where improvements are needed.
For example, ClearlyRated tracks loyalty, risks, and satisfaction through an intuitive dashboard that displays all feedback at a glance. You can quickly identify trends, manage issues, and receive critical feedback alerts to avoid potential problems. These insights drive targeted improvements that enhance the customer experience.
Surveys and feedback forms
Customer feedback is the backbone of CX measurement. Asking your customers how they feel after an interaction provides valuable insights into your service.
To do so, follow these tactics:
- Use short, targeted surveys right after an interaction to gather real-time feedback
- You want to avoid survey fatigue, so keep it brief and to the point
- Ask about specific touchpoints: Was the product description clear? Was your support agent helpful? How easy was it to check out?
Industry-specific surveys can give you quantifiable data, such as CSAT scores, but they also offer opportunities for qualitative feedback. You can ask customers to explain why they gave a certain score or ask open-ended questions to uncover pain points.
Collecting both types of feedback lets you understand not just the “what,” but also the “why” behind their satisfaction levels.
Customer interviews
Surveys and feedback forms give you quick glimpses, but interviews tell you more about your customers' experiences. Personal conversations with customers allow you to delve deeper into their pain points, thoughts, and emotions. Ask open-ended questions to get them talking. Understand what motivated them to choose your brand or what made them leave.
Customer interviews allow you to dig deep into emotions and attitudes that surveys might miss. You might discover hidden frustrations that customers don't even realize they have.
For instance, one customer might find your checkout process a little too lengthy, while another might be having trouble finding a product on your website. These are important for optimizing your customer experience.
Social media monitoring
Customers like to talk. Whether you like it or not, they’re already discussing your brand online. Social media monitoring enables you to listen in on these conversations. Monitoring mentions, hashtags, or even complaints on sites such as Twitter, Instagram, or Facebook provides you with an idea of how your brand is viewed.
Website and app analytics
Do your customers stay on the homepage or leave within seconds?
Do they bounce after viewing the product page?
What’s the average time spent per session?
These metrics tell you a lot about how customers behave when interacting with your digital platforms. You want customers to find what they’re looking for quickly and easily.
When you analyze customer behavior, you identify friction points, such as a confusing navigation bar or a slow-loading page, that disrupt their experience. Additionally, tracking specific user actions lets you optimize your website or app, helping customers smoothly navigate tasks like shopping for a product or filling out a form.
Support ticket analysis
When customers submit tickets, they often report problems or express dissatisfaction. Analyzing these tickets lets you spot recurring issues that could affect the broader customer experience.
For example, do customers constantly have problems with the same feature of your product? Are they struggling with a common issue that your support team takes too long to resolve?
If a large number of tickets take too long to resolve or get a negative response from customers, it’s a clear sign your team needs improvement. Analyzing these metrics helps you identify trends and areas where you need to offer better support.
How to Improve Customer Experience Based on Data
Now that you've selected your key customer experience metrics, it's time to put your plan into action. Here’s how you can use the data derived to improve your CX:
Implement feedback
Once you've collected feedback, you must act on it. When customers say they like or dislike something, you can make changes to your products, services, and operations. If customers frequently complain about frustration during checkout, for example, it's time to simplify the steps, eliminate unnecessary fields, or make the process faster.
In addition to the pain areas, it also allows you to emphasize where you're doing something right. Say, for instance, that customers adore a particular feature or service you provide, double down on it. You can also inform customers that you've taken steps based on what they've told you. That strengthens your bond with them, as it indicates you appreciate their input and are dedicated to improving things.
Personalize
Personalization is key to improving customer experience; data is your most powerful tool. 62% of business leaders say their personalization efforts have improved customer retention.
When you leverage insights about customer preferences, past behavior, and demographics, you can offer tailored experiences. For example, if a customer frequently buys athletic gear, send them targeted promotions for new sportswear.
You can also extend personalization to communication. Instead of sending generic emails, create campaigns that address the customer’s specific needs, preferences, or location.
Enhance employee training
Your employees are the face of your brand. How they treat customers directly impacts the overall experience. If a customer satisfaction rating declines after an interaction with a specific department, it’s a sign that additional training or support may be needed.
Consistent training helps employees handle a range of situations—from managing complaints to delivering great service. High employee retention also contributes to better, more consistent customer experiences.
Equipping your team with the right skills and knowledge ensures they can resolve issues quickly and effectively.
Leverage AI and automation
In an AI-driven world, a deeper truth matters more: the customer is always human.
The challenge? Using AI in a way that honors empathy, understanding, and connection.
AI excels at analyzing large volumes of data to uncover trends and issues humans might miss. ClearlyRated uses AI tools to reduce manual work and unlock deeper insights from open-ended feedback. The Gen AI-powered platform sorts sentiment automatically, so you can easily benchmark performance against industry standards.
Common Mistakes When Measuring Customer Experience
Be aware of these common roadblocks when measuring customer experience:
- Relying on a single metric: If you only measure NPS, you will miss other key insights that CSAT or CES might reveal. Various metrics present different perspectives, so depending on one means you're likely to make incomplete or misguided judgments. Instead, measure a group of metrics to get the bigger picture and spot patterns that will guide you towards improved decision-making.
- Ignoring qualitative feedback: Quantitative data from surveys and metrics give you useful numbers, but don’t show the full picture. If you skip customer comments, you might miss what really matters. People often share their frustrations, needs, and preferences in open-ended feedback. Read these comments carefully to find real insights that numbers alone can’t give.
- Not acting on insights: Don’t let valuable data go unused. If customers repeatedly mention long support wait times, address the delays. If they highlight a confusing interface, prioritize making it more intuitive.
Enhancing Customer Experience Measurement with ClearlyRated
Of course, there’s more to customer experience and service than just tracking metrics. You need to take action to make the insights valuable and implement improvements. Instead of viewing metrics as the final step, use them to assess the health of your customer relationships, not as the end goal.
And what better way to do that than using a customer experience measurement platform like ClearlyRated?
You can confidently compare your performance against industry benchmarks and competitors. The platform gives you real-time, customer-generated reviews that reflect your true service quality. It also provides third-party ratings, so you can track progress and spot areas that need work.
Plus, you can collect and analyze feedback from your customers with the help of NPS surveys. You can then use this information to improve service delivery and retain more customers. With benchmarking tools, you can compare your performance to competitors in your industry.
ClearlyRated also sends real-time alerts for at-risk customers. This helps you act quickly and address issues before they escalate. As a decision-maker, you gain actionable insights to improve CX and customer satisfaction continuously.
Optimize Customer Experience Measurement Metrics Easily and Efficiently
Gartner reports that companies linking customer satisfaction to growth and profit are 29% more likely to gain bigger CX budgets.
If you care about CX, you need a tool that tracks the full customer journey. Look for something that measures satisfaction, effort, and support performance. Make sure it includes dashboards, clear metrics, and data visuals that show where to improve.
ClearlyRated gives you the tools to act fast. You can track service quality, compare performance, and gather real-time feedback. Use this data to spot problems and fix them before they hurt loyalty.
Ready to enhance your CX and gain deeper insights into your customers? Book a demo with ClearlyRated today.
FAQs
What is the best metric for measuring customer experience?
Net Promoter Score (NPS) is widely considered the best metric, as it gauges customer loyalty and satisfaction with a brand.
How often should businesses measure CX?
Businesses should measure CX regularly, ideally after key interactions or monthly, to track trends and respond quickly to issues.
Can AI improve customer experience measurement?
Yes, AI can analyze large data sets, identify patterns, and predict customer behavior, providing more accurate and actionable insights for CX measurement.
What is the KPI for customer experience?
Some of the most common KPIs for CX include customer satisfaction (CSAT), net promoter score (NPS), customer effort score (CES), and customer retention rates.
FAQs


%20(1).png)

.webp)
.png)




%5B1%5D.webp)


.png)



_%20The%20Ultimate%20Guide.png)




.png)




%20in%20the%20Workplace.png)


.png)

%20and%20how%20can%20you%20increase%20it.png)
_%20A%20Step-by-Step%20Guide.png)

.png)
.png)


_.png)


%20in%202028.png)


_%20The%20Ultimate%20Guide%20(2024).png)


